Timings and experimental set-up |
All timings in this study were done on a collection of six machines, using clang as the compiler, and testing on a set of 17 matrices chosen from the Matrix Market. Times for matrix multiplication are obtained by doing 10,000 multiplications, repeating that five times, and selecting the minimum of those five times. The machines and matrices are described on this page, and our decision to use minimum times (rather than median) is discussed. The files containing timings are at the bottom of this page.
Machines
Six computers were used to produce timings for each of the “Specializers” developed in this study. The main characteristics of these computers are described below. The information was obtained from each computer's /proc/cpuinfo and /proc/meminfo files.
|
Computer |
Processor |
cpu (MHz) |
CPU cache size (Kb) |
MemTotal (Kb) |
OS |
|
loome1 |
Intel(R) Xeon(R) CPU E5640 @ 2.67Ghz |
2660.081 |
12288 |
12291944 |
Linux CentOS release 5.8 |
|
loome2 |
Intel(R) Core(TM) i7 CPU 880 @ 3.07GHz |
1200.000 |
8192 |
8132912 |
Linux CentOS release 5.8 |
|
loome3 |
Intel(R) Core(TM) i5-2400 CPU @ 3.10GHz |
1600.000 |
6144 |
8063880 |
Linux CentOS release 5.8 |
|
i2pc4 |
Intel(R) Xeon(R) CPU L7555 @ 1.87GHz |
1861.989 |
24576 |
65955912 |
Scientific Linux release 6.3 |
|
chicago |
Intel(R) Core(TM)2 Duo CPU P8600 @ 2.40GHz |
2400.000 |
3072 |
2097152 |
MacOS Lion 10.7.4 |
|
pl |
Intel(R) Xeon(R) CPU E5405 @ 2.00GHz |
1994.768 |
6144 |
2057296 |
Ubuntu Linux 10.04 LTS |
Matrices
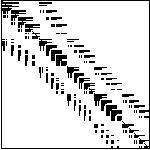
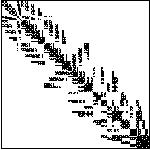
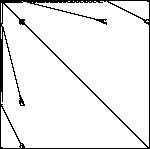
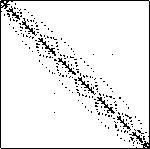
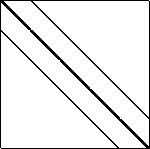
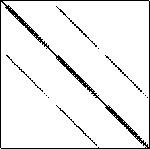
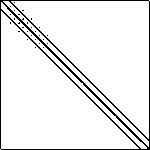
A set of 17 matrices were selected to conduct the test on the specializers. The matrices were obtained from the Matrix Market site (http://math.nist.gov/MatrixMarket/). The main characteristics of the matrices are summarized below. All information and images are from the Matrix Market, except for the non-zero counts; the Matrix Market representation (mtx) sometimes includes zeros (we don't know why), but we are reporting only actual non-zeros.
-
Name
Size
Non-zeros
Structured Plot
add32
4960x4960
19848

cavity02
317X317
5923
cavity23
4562X4562
131735

fidap001
216X216
4339
fidap005
27X27
279

fidap031
3909
91165

fidap037
3565X3565
67591

memplus
17758X17758
99147
mhd3200a
3200X3200
68026

mhd4800a
4800X4800
102252

nnc666
666X666
4032
orsreg_1
2205X2205
14133
pde900
900X900
4380

rdb2048
2048X2048
12032
saylr4
3564X3564
22316

sherman5
3312X3312
20793
utm5940
5940X5940
83842
Selecting Representative Time for the Specializers - Min Vs Median
Specializers are compared based on the time they spent to solve a given matrix. It is important to report the right time for a given specializer, which is not as simple as it sounds: as is well known, timings for the exact same computation, on the same machine, with the same inputs, can vary "randomly." The approach we used was to run each generated program five times (10,000 multiplications each time) and select the most representative time. However, which out of the five times can be considered the most representative of the set? Two answers were considered for this question: the minimum time and the median time. We use the minimum, for reason we now explain.
Although the median is more often used in statistical reports, we would argue that in this case, as a matter of principle, the minimum time is more meaningful. A computer can perform a given computation in some minimal amount of time; if it takes more time, it is because some event not associated with the computation slowed it down; our goal is to get the "cleanest" timing we can, so we would prefer the one that is contaminated by the fewest external events; that would be the minimum.
But there is another issue, and it is why median is used more often in other types of statistics, which is the issue of reproducibility, or predictability. In many situations, in a given set of samples, the extremes are considered more likely to be anomalous and to result from some random and unpredictable event. Thus, it is common to discount the highest and lowest measurements; taking the median is one way to do that. However, the argument made in the previous paragraph suggests that that might not be the case for the kinds of measurements we are taking. The question here is one of, so to say, expedience: which approach gives us the "smoothest" results, i.e. the results less likely to vary wildly and unpredictably.
One way to ask this question is just this: If we perform our experiment in the way outlined above - five runs of 10,000 multiplications - on the same code multiple times, which method will produce results that are more similar across those trials: minimum or median?
To settle this question, seven specializers and three matrices were randomly selected. Programs were generated for each specializer-matrix combination. Each generated program was used to produce twenty sets of five timing results; that is, we ran our usual method twenty times. Then the coefficient of variation of 20 minimum times was compared with the coefficient of variation of 20 median times. The tests were conducted on four computers: loome1, loome2, loome3, and i2pc4.
The coefficient of variation is a normalized measure of dispersion of a probability distribution, defined as the ratio of the standard deviation to the average of the sample.
Table 1 shows the coefficient of variation of minimum and median time values for each of the selected specializers and matrices over the four computers used for the tests.
Analyzing the results shown on Table 1 we can state the following observations:
The above discussion leads us to the conclusion that the minimum time value obtained from a set of runs of a given test (specializer-matrix-computer) is the most appropriate time to report. Thus, all timings we give on our web pages and papers (including the ones just below) are obtained by the method described in the first paragraph of this page.
CSV files
We will add CSV files as we do more experiments. For now, we have only the timings for the basic methods. (We have many, many more timings, of course, but mostly they don't seem very meaningful.) The format of each file is a series of lines of the form: machine, matrix, method, time (microseconds for 10,000 calls to multByM).
- CSV file containing timings of all basic
methods on all (seven) machines.
These are:
- CSRbyNZ.
- OSKI_1_2, 2_1, and 2_2. Technically, this is a mixed method: if the blocks don't fit exactly, there are leftover elements in the bottom row and/or far right column. These are handled by unfolding.
- CSR_1, ..., CSR_10.
- Unfolding. In terms of the specialize.py generator, this is "unfolding, 1000000, 1000000", i.e. this is unfolding with exactly one assignment per row.
- stencil.
- diagonal. Again, this is a mixed method. In terms of
specialize.py, this is obtained with argument
[split_by_dense_band, 1000000, 1000000, 80,
       [diagonal], [unrolling, 2]]
. That is, every diagonal that is at least 80% dense is handled by diagonal, and the rest are handled by CSR_2. Note that do not have timings for loome1 for this method. - MKL. Again, we do not have timings for loome1 for this method.
Last updated on Mon Aug 13 10:22:31 CDT 2012